
Starting with a lot of information
Last autumn, we were asked to build a new version of plaene.uzh.ch.
Alexandra Blankenhorn and her team from University Zurich (UZH) had already done a great deal of work and offered a detailed concept of the information they wanted to provide for every building. And they had a lot of information. Lists of all institutes, lecture rooms, museums, libraries, canteens and computer workstations for every building.
The application should be based on a map with all the buildings on it and some more information on the surroundings of every building. They didn't just provide us with a lot of data, but also with a lot of freedom and trust to create a good and simple solution for the task.
Designing for a small screen
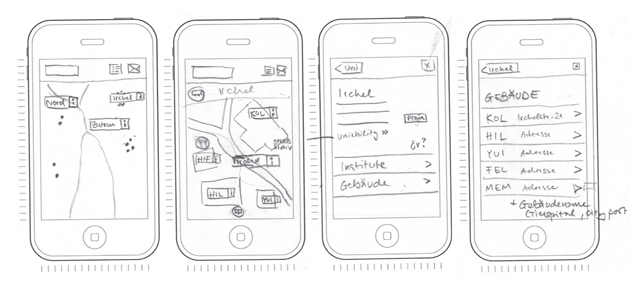
These long lists of buildings and lecture rooms for every building were the major challenge when Zahida started with the first scribbles. She designed mobile first and started with the most difficult situation. A lot of data on a small screen.
To solve the problem, all additional information was banned from the map, since it's purpose is to find a building and see how you can get there. Information about rooms and services inside a building open in a separate layer if you tap on the building name. Loïc called it “Inspector” and the name stuck. The navigation inside the Inspector is smartphone-oriented (with tappable lists and horizontal movement) and we kept this behavior also for tablet and desktop. Designing mobile first helped us to focus on what's essential and also create easier-to-use concepts for the classic website.
Wireframes for all the different cases
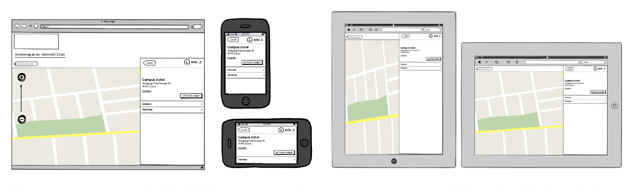
To create the basic grid and functionality of the website, Zahida designed Wireframes for Desktop and for Tablet and Smartphone in both orientations.
Ala came up with very beautiful designs — as always! And, they even built a clickable prototype.
Developers are the first test-users
As soon as they started developing, Reto, Colin, Sébi and Marco came back with a lot of feedback. They were the first ones to actually use the application and therefore the first ones to notice, when something didn't work out as we planned. We continually adapted the wireframes and provided solutions for emerging problems like “there are too many building markers on the map, they are overlapping” or “some institutes are distributed on different buildings, how do we solve that in the inspector?”. We met with the UZH project team at least once a week to discuss open issues and decided which solution to go on with. The best way for us was to define only the basic functionality of the site, but then stay flexible to adapt the details in collaboration with the team representing the stakeholders.
Choice of the map service
The plan was to display all the buildings with clickable “markers” on an interactive map. The first thing that comes to mind when talking about maps is Google Maps. But because of privacy concerns about the way Google tracks user requests via cookie we also looked for other options. In the end we chose to use the open data solution provided by OpenStreetMap.
OpenStreetMap it is, now what?
Looking at the project from a technical point of view we were facing some challenges. First of all the decision to host the site at the university network has been made. Also the map tiles should have a customized style. That means we couldn't just access the tiles from the OpenStreetMap server. We had to setup our own server and serve customized tiles from there.
Setup the server
To be able to render our own map tiles, we installed Mapnik2[1] with all of its dependencies. Mapnik2 uses PostgreSQL as a database, so we decided to also use PostgreSQL for the project itself. We downloaded the map data from one of the several OpenStreetMap servers[2]. With all that stuff setup we could use the python scripts Mapnik2 provides to generate the tiles according to an xml which specifies how the tiles should look like. Depending on the bounding box of the area you are rendering the tiles for it can take quite a while.
Openlayers and HTML markers
We have not found any possibility to display markers containing HTML by default, so we have created two classes which enabled us to have HTML-markers. They are called HtmlBox and HtmlMarker. Click here to check it out, there is also an example HTML file provided in the archive, in case you would like to use it too. There is a little catch with this though. You will need to edit two lines in the “lib/OpenLayers/Layer/Markers.js” respectively the OpenLayers.js file. We have opened a pull-request[3] for that matter, but sadly it has not been merged yet. There you can see what needs to be changed to get our classes to work flawlessly.
Small and big screens
Since the website should be looking good on small devices too, responsive design was the way to go. We used media queries to apply different CSS styles based on the size of the viewport. That is a very easy but powerful way to make a site viewable on differently sized devices.
And now it gets hollywoodesqe
Everybody involved in this project was very dedicated, committed and constructive. A special “Thank you” for the awesome collaboration goes out to UZH-Project-Team, to Ala and to Steve, who facilitated our regular project retrospectives and further improved our work together.
[1] mapnik.org