
The tradition demands it that if the böögg explodes after a short time, there will be a lot of summer days, if it takes longer then we will have more rainy days. It reminds me a bit of the groundhog day. If you want to know more about the böögg, you should check out the wikipedia page de.wikipedia.org/wiki/Sechseläuten.
Now people have started to bet on how long it will take for the böögg to explode this year. There is even a website that lets you bet on it and you can win something. In my first instinct I inserted a random number (13 min 06 seconds) but then thought – isn't there a way to predict it better than with our guts feeling? Well it turns out there is – since we live in 2016 and have open data on all kinds of things. Using this data, what is the prediction for this year?
590 seconds – approximately 10 minutes.
We will have to see on Monday to see if this prediction was right – but I can offer you to show now how I got to this prediction with a bit of eyeballing and machine learning. (Actually our dataset is so small that we wouldn't have to use any of the tools that I will show you, but its still fun.)
Step 1: Get some böögg data
Thanks to a very helpful github user we have an already pre-parsed representation of the 56 years of data that the wiki has to offer us on the explosion times of the böögg. To import it with pandas you need only two of lines:
import pandas as pd
source = "https://raw.githubusercontent.com/philshem/Sechselaeuten-data/master/boeoegg_burn_duration.csv" table = pd.read_csv(source, sep = ',', encoding = 'latin1')
If you use jupyer notebooks You will get a nice table of the data that looks like this.
| year | burn_duration_seconds | |
|---|---|---|
| 0 | 1952 | 360 |
| 1 | 1953 | 480 |
| 2 | 1956 | 240 |
| 3 | 1958 | 480 |
| 4 | 1959 | 480 |
Well, now in order to predict how long its going to take this year, the first thing that came to mind was weather data. If it rains it won't probably burn that well and if its cold that doesn't help either. MeteoSchweiz offers some open data. You can get it and parse it from here (Btw. Precipation = “Niederschlag”):
| Year | Month | Temperature | Precipitation | |
|---|---|---|---|---|
| 0 | 1864 | 1 | -6.6 | 25.7 |
| 1 | 1864 | 2 | -1.5 | 32.9 |
| 2 | 1864 | 3 | 4.5 | 51.0 |
| 3 | 1864 | 4 | 6.8 | 46.9 |
| 4 | 1864 | 5 | 12.3 | 78.4 |
Now we have to find out on which day each year the Sechseläuten took place. Luckily someone posted a short python snippet on wikipedia that helps us with this. It allows us to get the correct month and this lets us look up in our table how cold it was and how much precipitation (Niederschlag) there approximately was on those days. The merged table looks like this:
| year | burn_duration_seconds | Temperature | Precipitation | |
|---|---|---|---|---|
| 0 | 1952 | 360 | 10.4 | 103.6 |
| 1 | 1953 | 480 | 9.2 | 85.6 |
| 2 | 1956 | 240 | 6.6 | 95.6 |
| 3 | 1958 | 480 | 5.4 | 102.4 |
| 4 | 1959 | 480 | 9.5 | 65.3 |
So we are almost done. Now its time to have a look at what we will find in the data. Pandas and matplotlib is great for that. In only two lines it allows us to create a scatterplot matrix that shows us all correlations there are amongst the variables.
from pandas.tools.plotting import scatter_matrix
scatter_matrix(table, alpha=0.8, figsize=(6, 6), diagonal='kde') #kde = Kernel Density Estimation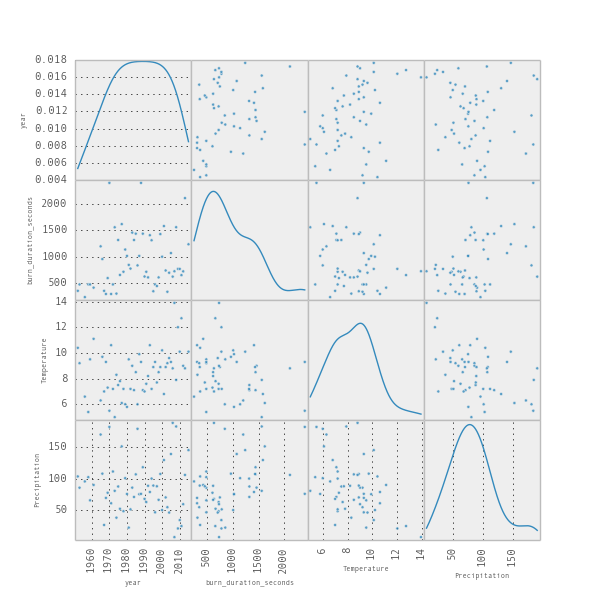
The things on the diagonal are kind of fancy histograms, and in each cell you get a scatterplot of how well one variable (e.g. year) correlates with another (e.g. temperature). (Global warming anyone?). We might chose to have a more detailed look on the correlations between temperature, year and precipitation and the burning time. Let's see if that helps us to understand what is going on (Btw. the blueish area corresponds to how much confidence we have in the line that we put through the data. The narrower it is the more we “trust” it.)
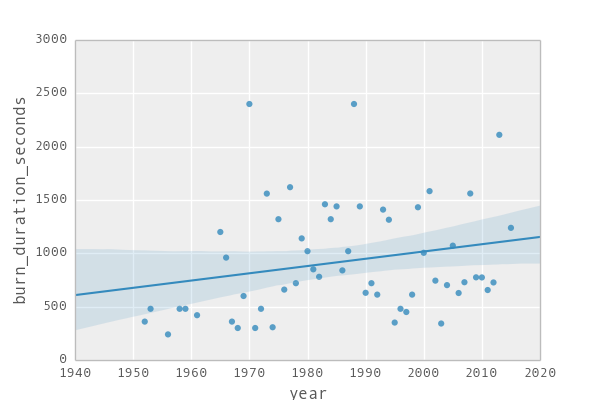
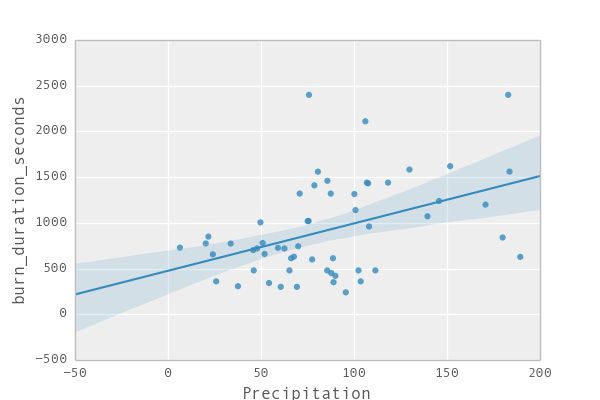
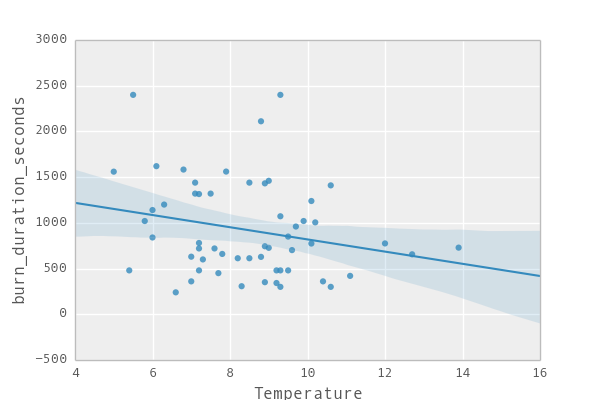
By eyeballing we see that in the current times the böögg takes longer and longer to explode. We also find that the less humididy or rain there is, the faster it tends to explode. And finally we also see that the hotter it is on that day the faster the böögg tends to explode. So great – this gives us already an idea of what is going on.
Step 5: Build a model
We could build a linear regression model to predict the data (something you probably still know from high school), but we could also use something fancier like the lasso regression, which is a form of machine learning linear regression that tends to put emphasis on the “true” contributors (independent variables) that drive the outcome (dependent variable). Normally we would split the data into a training and test set to measure how good our model is (and also use crossvalidation to find the correct parameters) but to make this post short we won't do any of that. Actually building the model is just one line of python:
lasso_model = Lasso(alpha=0.01, fit_intercept=True).fit(X,y) #X is independent variables (like temperature, rain and rain), y is the vector of burning times that we are trying to guess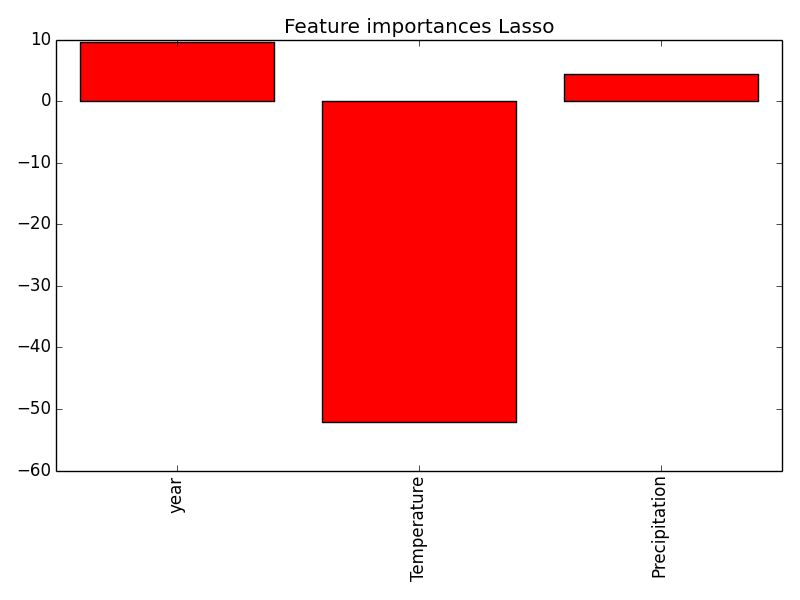
We see that the lasso regression especially emphasizes the effect of the temperature on the burning time, while precipitation and year don't seem to be that important and have the inverse effect on the burning time. So something that we have already seen in the graphs above.
Step 6: Predict stuff
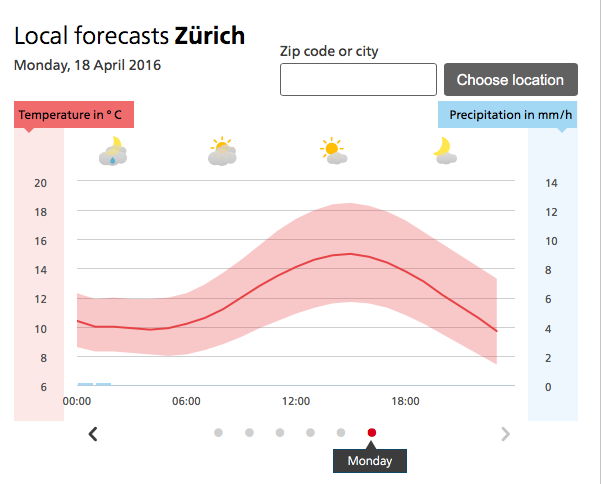
Well now its time to ask the wise model to make the prediction for this year. We need to guess the temperature this year and the precipitation. Well lets look what meteo predicts. The homepage states: “Der Umzug für Volk und Stände und das Anzünden des Bööggs um 18 Uhr sind die Höhepunkte des zöiftigen Zürcher Frühlingsfestes.”. So looking at the chart around 18 o'clock we see that we will have around 13°C and 0 precipitation.
The last remaining step is to enter the parameters inside the model and see what it predicts:
print "The böögg will burn this year for %s seconds." % lasso_model.predict([[2016,13,0]])[0]
The böögg will burn this year for 590.667449568 seconds.
So finally we arrived at the answer: 590 seconds or approximately 10 minutes. Thats what we could enter into the contest and see if we win, but I guess our chances will be rather slim, since 10 minutes is a very rough guess that everybody gives and our model isn't very good at what it's doing (But to find that out is something for another blog post :) ) On a side note: To find out if the böögg is acually good at predicting how many summer days we will have this year might also be a fun topic :)
I hope you found this post entertaining and maybe have lost a bit of fear to work with python, pandas, matplotlib or scikit.
Drop us a line if you feel you might want to experiment with the Ipython Notebook or want to talk to us about your website, app or business data.
In any case see you on Monday @ the böögg to find out what will happen
Plotti