
It has been nearly 7 months since Drupal 8 first release and as a developer, I am still in the learning process. It can be hard sometimes to know what is going wrong with your code and how to solve it. I will tell you about few things to know on how to develop and debug Drupal 8 projects and continue learning, learning and learning !
Disabling cache
First of all, to avoid having a crazy terminal with thousands of drupal cr hits, you can disable Drupal caching during development. You need to copy and rename sites/example.settings.local.php file to sites/default/settings.local.php. Then uncomment/update some values:
- uncomment this line to enable the “null cache service”:
$settings['container_yamls'][] = DRUPAL_ROOT . '/sites/development.services.yml';- uncomment these lines to disable CSS/JS aggregation:
$config['system.performance']['css']['preprocess'] = FALSE;
$config['system.performance']['js']['preprocess'] = FALSE;- uncomment these lines to disable the render cache and the dynamic page cache:
$settings['cache']['bins']['render'] = 'cache.backend.null';
$settings['cache']['bins']['dynamic_page_cache'] = 'cache.backend.null';- you can allow test modules and themes to be installed if needed with:
$settings['extension_discovery_scan_tests'] = TRUE;To include this file as part of Drupal's settings file, open sites/default/settings.php file and uncomment these lines:
if (file_exists(__DIR__ . '/settings.local.php')) {
    include __DIR__ . '/settings.local.php';
}
Then, to disable Twig caching, open sites/development.services.yml file and add the following settings:
parameters:
    twig.config:
        debug: true
        auto_reload: true
        cache: false
Finally, rebuild the Drupal cache and it is done !
Displaying errors
As in Drupal 7, you can set different levels of errors display (by visiting this page: /admin/config/development/logging in the administration interface):
- None
- Errors and warnings
- All
In Drupal 8, there is a fourth level called “All messages, with backtrace information”. This is native to Drupal core and it allows to display the error backtrace in the message area.
You can also adjust the level of errors in your local setting file:
$config['system.logging']['error_level'] = 'verbose';Creating log messages
Developers from Drupal 7 know the Database Logging module that allows to log messages in the database using the famous watchdog() function.
Well, this module still exists in Drupal 8 but the function has a replacement : the Drupal 8 logger class.
It looks like this:
// Logs an error
\Drupal::logger('my_module')->error($message);
Let's have a look at the different parts of the code:
\Drupal::logger(‘my_module')is the helper method that quickly creates a copy of the logger service. As a parameter, it takes the module name from where we log the information;->error:this is the severity-level method (it can bedebug,info,notice,warning,error,critical,alert,emergency);$messageis the log message. It can be a simple string or it can contain some placeholders. In this case, you can pass the associative array (placeholders as keys) as a second parameter.
All the messages created with the logger service can be viewed in the reports page of the administration interface in /admin/reports/dblog as it used to be in Drupal 7.
Debugging Twig templates
Drupal core comes with a theming debug mode that is really helpful for local environments. To enable it, copy-and-paste the following code into sites/default/services.yml file (if you haven't already added these lines in development.services.yml):
parameters:
twig.config:
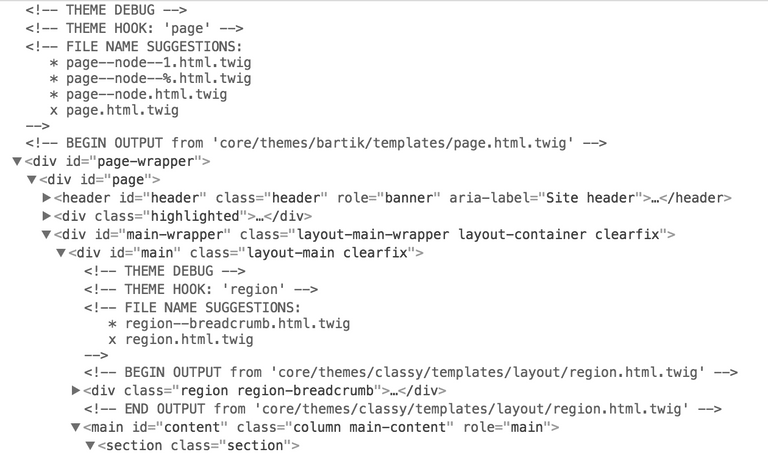
debug: trueThanks to this mode, it will be easier to find out which portion of HTML code has been written in which templates: in the source code, you will see each part of Twig templates (pages, nodes, blocks, menus etc.) surrounded by HTML comments that contain the matching suggestion templates. The one in current use will be checked.
Make sure to enable comments in your web browser debug tab and also note that this feature has been backported to Drupal 7.
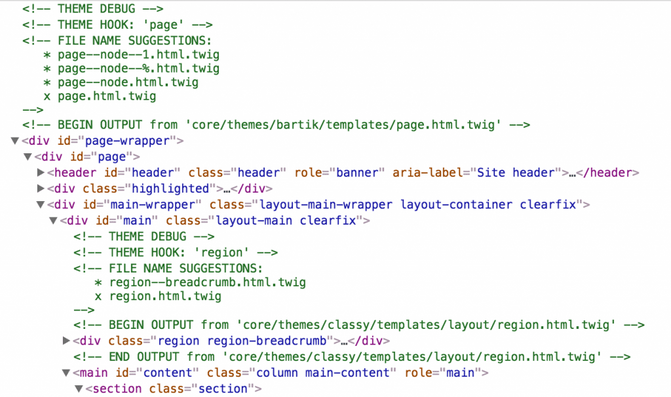
Used templates mentioned in HTML comments
Inside a Twig template, you will also be able to use {{ dump(my_variable) }} syntax to print a variable content.
If you have Devel Kint module installed, you can use {{ kint(my_variable) }} to dump the variable in a nice formatted structure: you can hide/show levels of arrays/objects which is very helpful as Drupal variables can have many levels inside. Kint is indeed the successor of the krumo() function from Drupal 7.
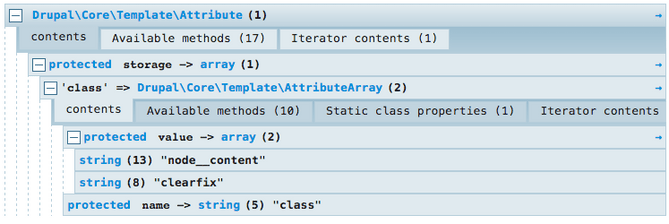
Print content_attributes variable with kint from node.html.twig template
Profiling pages
When dealing with performance issues, profiling a website will help finding what is the root cause.
The well-known debugging module Devel offers in its latest version a Webprofiler. It is actually a (partial) port of the Symfony profiler and it displays a footer bar on every page with useful data collectors such as:
- Drupal current version;
- PHP configuration (current version, loaded modules);
- route and controller name;
- page load timeline and memory use;
- query time and number of queries;
- number of blocks loaded and rendered;
- number of views;
- number of modules and themes available;
- cache statistics.

Webprofiler bar in Drupal 8
By clicking on each section, you will be redirected to a specific page with more details about the collected data. For instance, if you look at the page request details, you will see which was the matching route, the route object with the passed parameters, response headers etc. Well, all the information needed to debug requests.
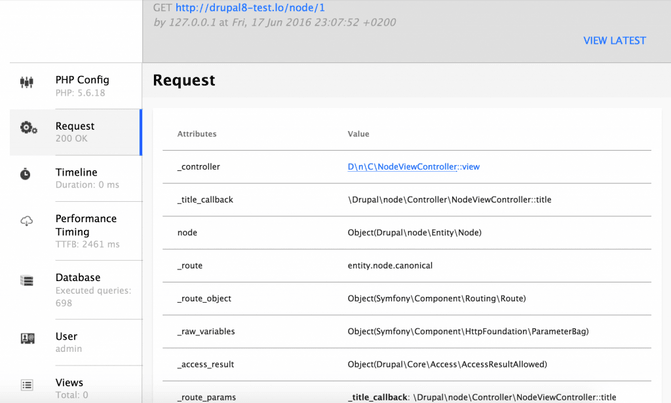
Details of a page request provided by Webprofiler
Using command line tools
The Drupal Console project is a powerful command line tool that makes use of the Symfony Console and other third-party components. It is complementary to Drush and allows you to generate code to build modules and themes (code scaffolding), to interact with your Drupal installation and help to debug your code.
Once the Drupal Console installed, you can run the drupal list command to show all available commands.
Here are some useful commands for debug:
drupal check: check system requirements;drupal site:status: show current Drupal installation status (Versions of Drupal, PHP, MySQL and libraries, updates status, cron last run, database connection etc.);drupal database:table:debug: show all tables of the database;drupal database:table:debug my_table: show columns ofmy_tabletable;drupal config:debug: list all configurations;drupal config:debug image.settings: show configuration forimage.settings;drupal config:settings:debug: display currentkey:valuefrom the settings file;drupal container:debug: display all services ID with the matching class name;drupal router:debug: display all route names with the matching paths;drupal router:debug dblog.overview: display route information about dblog overview page;drupal database:log:debug: display current log events;drupal database:log:debug 107: display one log event in details;drupal site:statistics: show some statistics about the website (number of modules enabled/disabled, number of users and comments etc.).
The Drupal Console is already used by many companies well known in the Drupal community such as Acquia, Amazee Labs, Phase2 and Commerce Guys and is becoming the standard command line tool for Drupal 8.
But note that the current version is not yet fully compatible with Drupal 8.1.x, for instance, there are still some issues with migration commands. The team of the project is currently looking for some financial support and more contributors to get a full stable release.
For more information about the project, check out the official website and the documentation.