

In my previous blogpost, we saw that using machine learning (ML) on Google Analytics (GA), we can go one step beyond traffic analysis. ML will bring light on correlations in your traffic data, let hidden rules emerge and help making predictions. A typical use case could be discovering customers segments for an eCommerce website.
After running a short experiment, we already discussed the requirements for ML and the limitations of on doing that on GA.
In this article, I will describe the quickest way to test ML on your traffic data. For that, we will first need to transform GA statistic data into raw data compatible with ML. Then using a free ML software, we will import, visualize and transform data to optimize predictions. Finally we'll compute a first decision tree for predicting the class of a visitor based on its characteristics.
The software we'll use is Weka. If you decide to start experimenting, I recommend to have a look on some online courses on the subject, or at least doing a simple tutorial.
Throughout this article, we'll take the use case seen in the previous blogpost : predicting if a new visitor on this very blog would be interested in our jobs open position, based on historical user data and access to the job page.
Get machine learnable data from GA
Exporting CSVs from views in GA's web interface is possible. However querying a wider range of user defined dimensions won't be. For that, we'll use Google's Core Reporting API. Some handy online tools using that API will let you prototype your experiments quickly. Google Analytics spreadsheet add-on will allow you to import the result of your query into a Google spreadsheet. It will be handy for playing with columns or merging results. If you want to perform some quick parameters testing, you will preferably use GA Query explorer. Finally, if you need functional information on existing dimension or metrics, have a look on the dimensions and metrics explorer.
If you'd like to access your data programmatically, you'll have to invest time on directly using Core Reporting API. In this case, you'll need to enable Analytics API on your account.
The actual query
To make it simple, let's take the hypothesis that visitors accessing the job pages are developers and there is chances it will have an impact on their browser choice and operating system . The accuracy of this inference is discussable because there will also be many developers not accessing the job pages and it will bias the results. In anycase, it will help finding the typical profile for people who access the job page.
On Google Analytics spreadsheet add-on, let's use the following parameters:
| Metrics | ga:sessions |
|---|---|
| Dimensions | ga:browserga:operatingSystem |
After running the report, one row will be outputted for each actual visitor's values combination of the queried dimension. And with that row, a statistic (metric) – the number of corresponding sessions. For example:
| Browser | Operating System | Sessions |
|---|---|---|
| Chrome | Macintosh | 3 |
| Chrome | Windows | 1 |
We saw previously that for ML, we cannot use statistics on aggregate data, but we need each occurrence instead. The more occurrence you have, the better it is. To have one row per case, the idea is to add a dimension whose value will change at (nearly) every hit : the minute index (ga:nthMinute). For the same data, in the end, you will get :
| Minute index | Browser | Operating System | Sessions |
|---|---|---|---|
| 1 | Chrome | Macintosh | 1 |
| 34 | Chrome | Macintosh | 1 |
| 125 | Chrome | Macintosh | 1 |
| 452 | Chrome | Windows | 1 |
The ML algorithms being driven by the minimization of misclassified instances (rows), those repetitions are crucial
Once you got the data from GA, you wanna keep the attributes that matters for classification, thus get rid of the nth Minute and Sessions columns. We also need to provide the resulting classification (developer, not_developer). In the end, we would like something like this:
| Browser | Operating System | Class |
|---|---|---|
| Chrome | Macintosh | developer |
| Chrome | Macintosh | developer |
| Chrome | Macintosh | not_developer |
| Chrome | Windows | not_developer |
Depending on your usecase, the classification column could have been one of the queried dimension or metric, or like our case, the rows associated with ‘developer' and the one associated with “not developer” come from different GA reports that have been merged into one. We'll see why now.
Mind your classification !
Keep in mind that all dimension combination won't make sense for data mining. For our use case, we could have added the dimension ga:pagePath for the class column , then transformed the pagePath value to “developer” if pagePath==”https://www.liip.ch/en/jobs”, or “not developer” if otherwise. It would have been logically wrong since the same user probably visited other pages and would have inferred rows marked as “not_developer” for the same visitor characteristics.
In order to aggregate data at user level, we defined two user segments in the GA web interface:
| segment | filter type | filter value |
|---|---|---|
| developer | “user” include “page” | liip.ch/en/jobs |
| not_developer | “user” exclude “page” | liip.ch/en/jobs |
Then we produced one report per segment, each of them with the appropriate class value, then merged them into one.
Be aware that when you use segments:
- the maximum period length you'll be allowed to use is 90 days.
- Some dimensions and metrics cannot be used with segments (check the documentation)
Tips for Google Analytics spreadsheet add-on
Here are some useful tips concerning the spreadsheet add-on report parameters:
| Last N Days | You can use this instead of “Start Date” and “End Date” |
|---|---|
| Segment | You can use GA Query explorer to find your segment id (ex: gaid::QdYRP0-hRSyeoqb1dFrT2) |
| Max Results | Set it to 10000 (maximum) |
Exploring data
Note
In case you don't have an analytics account while you're willing to follow this example, I made up this test file for you.
At last, let's import your CSV file in Weka.
Have a look on data
After loading your csv file into Weka, have a look on it on the preprocess tab. try the visualize all button:
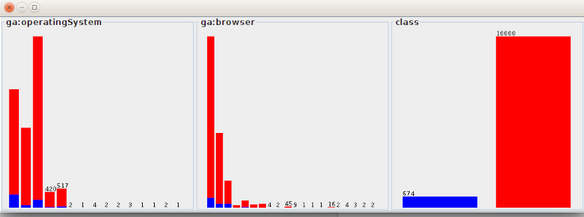
We can see here that the blue class (developer) is under represented. This is not surprising since the developer class come from a segment of visitors with very specific conditions. With such a data set, the decision tree will just output a tree tell you to always choose “not developer” to have a 93% success rate.
Balancing
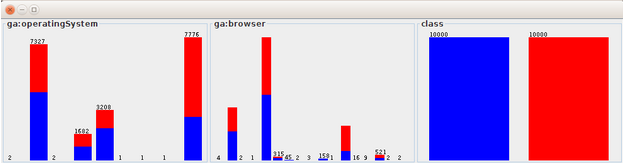
To avoid that, let's resample our data with the SMOTE filter. Select supervised->instance->SMOTE filter and click Apply. In our case, we will resample the developer class by 1400% (1000/674*100). This will producing new instances composed by random values picked from neighbor instances.
Here is what data look like after balancing them:
Also have a look in the visualize tab, where you can see how the classes distribute in different dimensions :
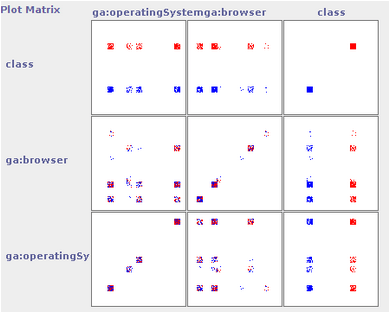
Play with the jitter parameter in order to visualize the amount of data
Simplifying data
Classifying users that have very unusual browsers or OS will not contribute much in improving our overall prediction success rate. It will just make our tree more complex. So let's get rid of those instance by applying the filter unsupervised->instances->RemoveWithValues. In this filter parameter, enter the id of the concerned dimension (1 for ga:operatingSystem, 2 for ga:browser), and the value id to remove. Because we want to clean the tree structure, make sure to set “modifyHeader” to True.
Apply the filter and visualize your changes.
Note
Weka provide many filters to transform your data if needed. However it's sometime more flexible to make your own scripts, especially if you need to experiment and do the same transformation over and over. For this purpose I'm developing a small python toolset for transforming csv files.
Producing a first decision tree
Under the classify tab, you will run your first ML algorithm. We will choose the classifier trees->J48. This is the Weka equivalent of the C4.5 algorithm that produce a decision tree prediction model.
While training, a model is constantly evaluated against a test data set. Select cross-validation under Test options to get the best results in our case. As this testing strategy will split the dataset into different folds, you need the make sure our developer and _notdeveloper classes will be well spread across the data set. If you're data are not yet randomized (especially after the SMOTE filter), apply the unsupervised->instances->Randomize filter before.
After running the algorithm, you will get the J48 result in a buffer with a textual description of the tree, that you can visualize by right-clicking on the result buffer in the buffers list.
In that same buffer, evaluate the performance of your tree under Correctly Classified Instances.
Summary
| Correctly Classified Instances | 12517 | 62.6822 % |
|---|---|---|
| Incorrectly Classified Instances | 7452 | 37.3178 % |
| Kappa statistic | 0.2537 | |
| Mean absolute error | 0.4607 | |
| Root mean squared error | 0.4802 | |
| Relative absolute error | 92.1413 % | |
| Root relative squared error | 96.0415 % | |
| Total Number of Instances | 19969 |
This performance must be compared to the baseline accuracy, given by performance of the classifier rules->ZeroR.
It's also always a good idea to compare your performance with the rules->OneR classifier. It will compute the attribute that best predict your classification, and produce a decision tree out of this only attribute. Simple is the best.
Wrap up
Here you are. I hope this small hands-on can give you the basics to make some simple analysis and predictions. I recommend following the Weka online courses if you're interested in the subject.
To sum up, we saw that:
- You must add the nthMinute dimension to transform Goolgle Analytics aggregate data to raw data for ML.
- Use segments for queries if you need to filter results with conditions at hit, session or user scope. Refer to the scope of your prediction.
- Balance the classes of your training set with the SMOTE filter if they aren't. Otherwise the resulting prediction model might be to always choose the popular class.
- Compare your performance result with ZeroR and OneR classifiers to relativize the performance of the J48 classifier.
Please don't hesitate to share feedback and experience on GA / ML.